
Sunday, November 22, 2009
unemployment movie
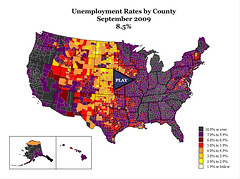 Click the map to see unemployment change monthly, from January 2007 through September 2009. This map/unemployment story is by LaToya Egwuekwe.
Tuesday, November 03, 2009
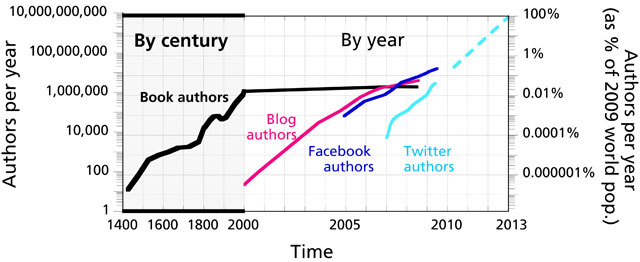 (click image to enlarge) This graph indicates the approximate number of new authors per year as a percentage of the 2009 world population, from 1400 through 2013 (estimate). Soon nearly everyone will be a "writer".
Read more about the increase in the number of authors/writers, from the 1400's to the present, here: A Writing Revolution

![]()
Subscribe to Posts [Atom]