
Sunday, February 28, 2010
Obama 2011 Budget Proposal
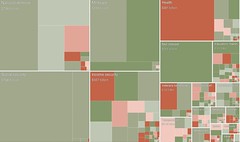 Rectangles in the chart are sized according to the amount of spending for that category. The 2011 Federal Budget is $3.69 trillion.
Color shows the change in spending from 2010. Click the image to see an interactive version by the New York Times.
Tuesday, February 16, 2010
A State of the Nation Overview as of February 15, 2010
Thursday, February 04, 2010
The Economy Grows Fastest In Democratic Administrations
 This table indicates what has happened, economically to families, over about the last 60 years. Namely families do better under Democratic Presidents than Republican Presidents, the percentages being 2.78% to 1.64% (average annual growth of real gross national product), respectively. Read the complete article, "Would Obama’s Plan Be Faster, Fairer, Stronger?"

![]()
Subscribe to Posts [Atom]